
Why EVA Foam Shrinks
A complete analysis of POE melting behavior DCP crosslink density and cooling
How IUS-4065 may improve secondary shrinkage and dimensional stability in ultra-soft formulations
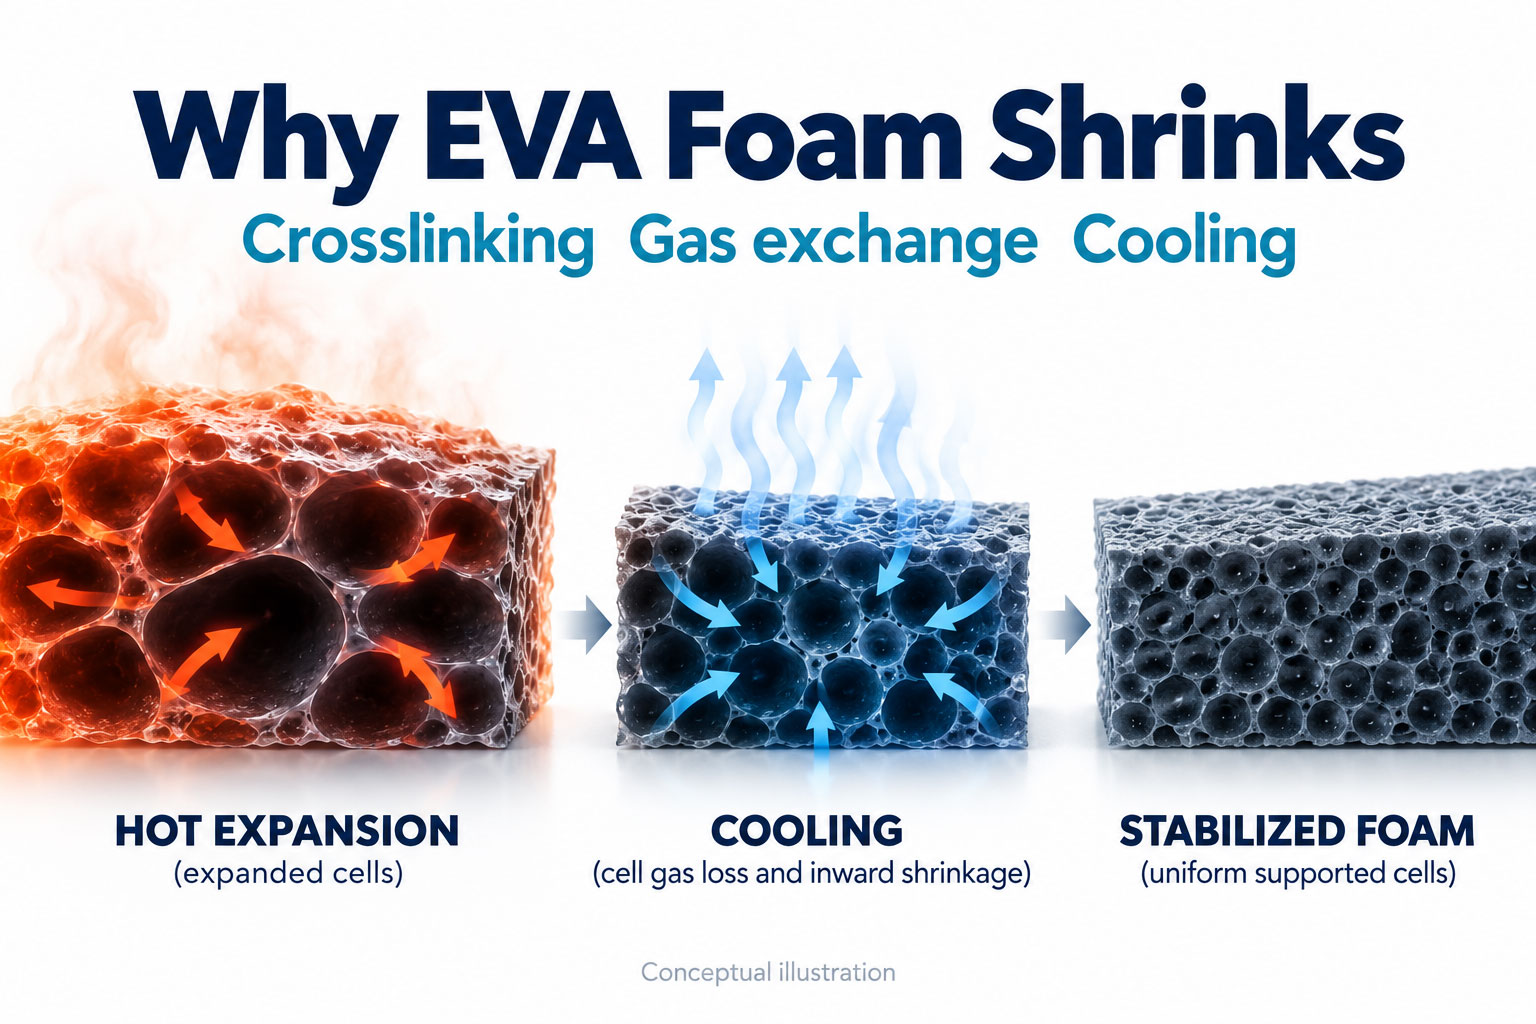
EVA foam shrinkage results from interacting changes in cell pressure, gas diffusion, polymer recovery, crystallization, crosslink fixation and cooling gradients. Solving it requires a balanced formulation and a controlled thermal history.
IUS-4065 combines supplier-reported hardness of about 40 Shore A with a melting point of about 64°C. This balance may reduce the loss of crystalline support during secondary heating in ultra-soft POE formulations; the benefit must be confirmed in the finished foam.
1 Three time scales of foam shrinkage
Production teams often call every reduction in dimensions “shrinkage,” but different stages have different dominant mechanisms. Identify when the change occurs before adjusting the formulation.
| Type | Typical timing | Main drivers | Production signs |
|---|---|---|---|
| Demolding shrink-back | Seconds to minutes after mold opening | Insufficient crosslinking, cell pressure imbalance or low melt strength | Rapid recoil after initial expansion; high density or wrinkled skin |
| Post-shrinkage | 24–72 hours or longer | Gas diffusion, crystal reorganization and residual stress release | Acceptable initial dimensions drift the next day |
| Secondary thermal shrinkage | After lamination, hot pressing, baking or warm storage | Melting of low-temperature crystals, chain relaxation and cell re-equilibration | Warpage, curled edges and loss of dimensional tolerance |
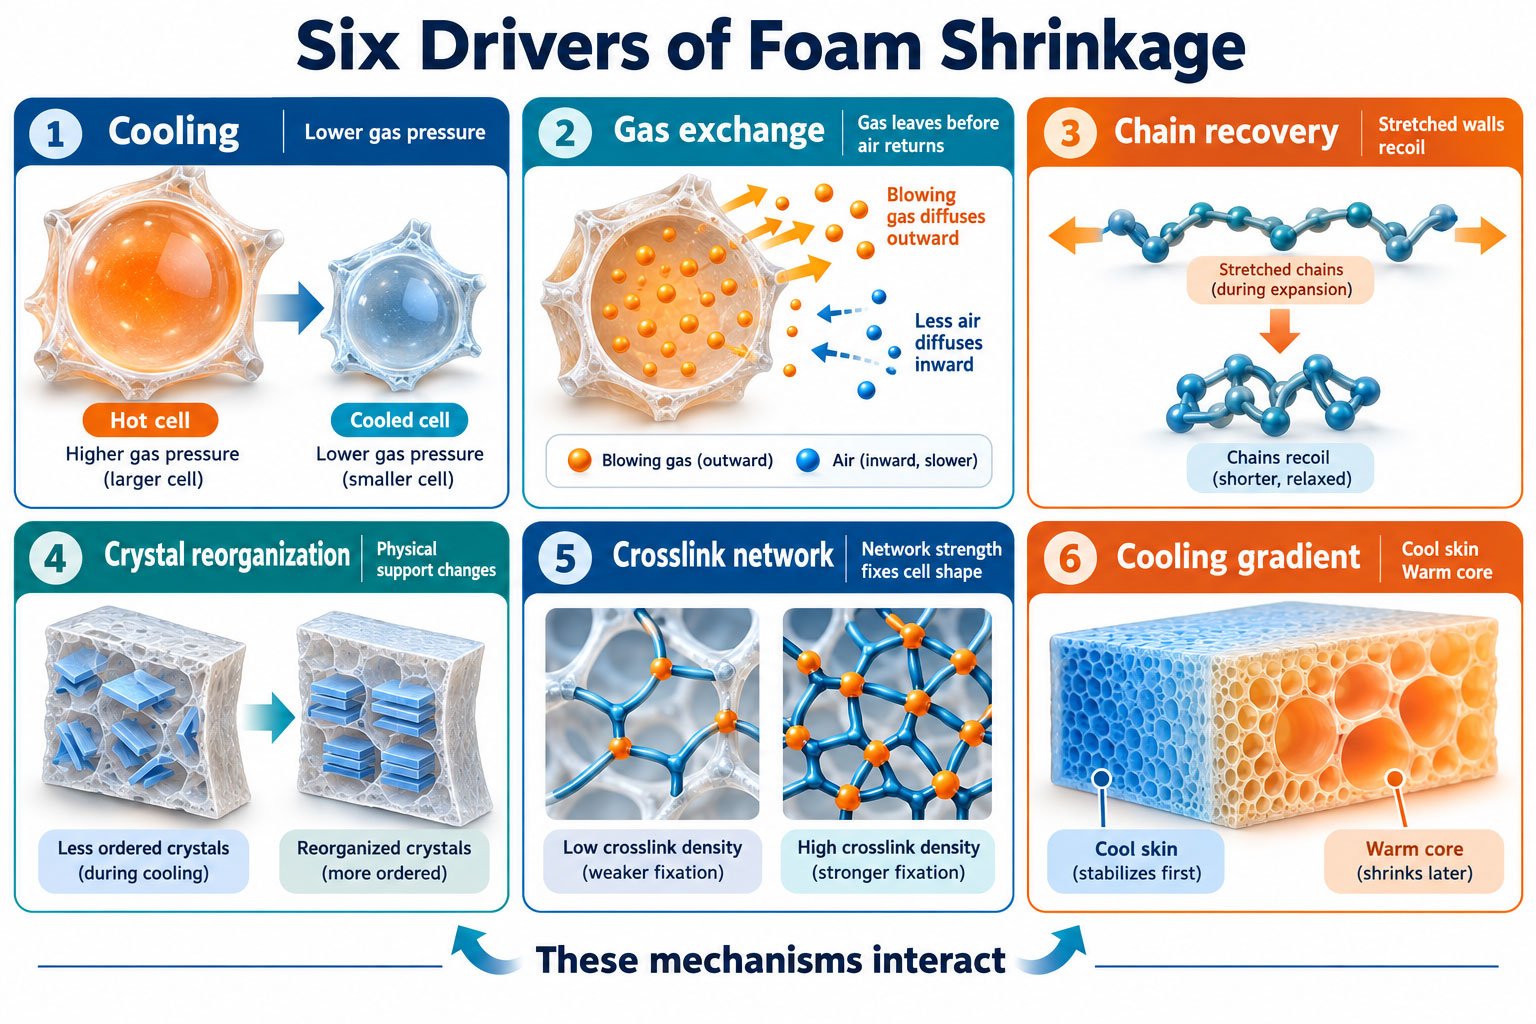
2 Why foam cells tend to shrink during cooling
Cell gas pressure falls as temperature decreases
During foaming, gas inside the cells is hot and pressurized. An ideal-gas approximation provides a useful first view of the relationship between pressure, temperature, gas content and cell volume.
P ≈ nRTV
As temperature T falls, and gas diffusion reduces the number of moles n, internal pressure decreases. If atmospheric pressure and the restoring force of the cell walls exceed internal support, cell volume V contracts.
Blowing gas loss and air ingress occur at different rates
The solubility and diffusion coefficients of gases released by azodicarbonamide (ADC), carbon dioxide (CO₂) and other blowing systems generally differ from those of air. If cell gas escapes faster than outside air enters during early cooling, pressure inside the cells can temporarily fall below ambient pressure. High expansion, thin cell walls and warm storage can intensify this effect.
Viscoelastic recovery and residual stress
Expansion stretches and orients polymer chains and cell walls. Without sufficient support from the crosslink network or crystalline domains, the chains recover toward a lower-energy state. The result can be shrinkage in length and width or a reduction in thickness.
These mechanisms act together. A change in gas exchange may reveal a weakness in the network that was not obvious immediately after demolding.
3 POE melting behavior and secondary shrinkage
POE is commonly added to EVA to reduce hardness and improve flexibility and rebound. Many ultra-soft POE grades have low density, low crystallinity and a low melting range. At room temperature, their crystalline domains provide reversible physical junctions. As lamination or downstream temperatures approach that melting range, crystalline support weakens and the chemical crosslink network must carry more of the load needed to retain cells and dimensions.
DSC interpretation. A melting point is not an absolute switch. POE can have a broad melting peak. Review onset, peak, endset and melting enthalpy ΔHₘ together. Processing time, part thickness and heat transfer also matter; a single peak temperature cannot establish a safe processing temperature.
Low melting point and low crystallinity favor softness and a soft low-temperature feel, but physical support is lost earlier during heating.
Higher EVA vinyl acetate (VA) content generally reduces crystallinity and melting temperature, potentially adding to the effect of a soft POE phase.
Increasing POE content can change phase continuity, melt viscosity and the distribution of DCP reactions.
Even with an equipment setting of only 55–60°C, actual core and local contact-surface temperatures and residence time must be measured.
4 The DCP crosslink density window
Dicumyl peroxide (DCP) decomposes on heating to generate radicals that form covalent crosslinks between EVA and POE chains. The network provides melt strength during rapid gas generation and cell growth, then helps retain cell geometry after cooling.
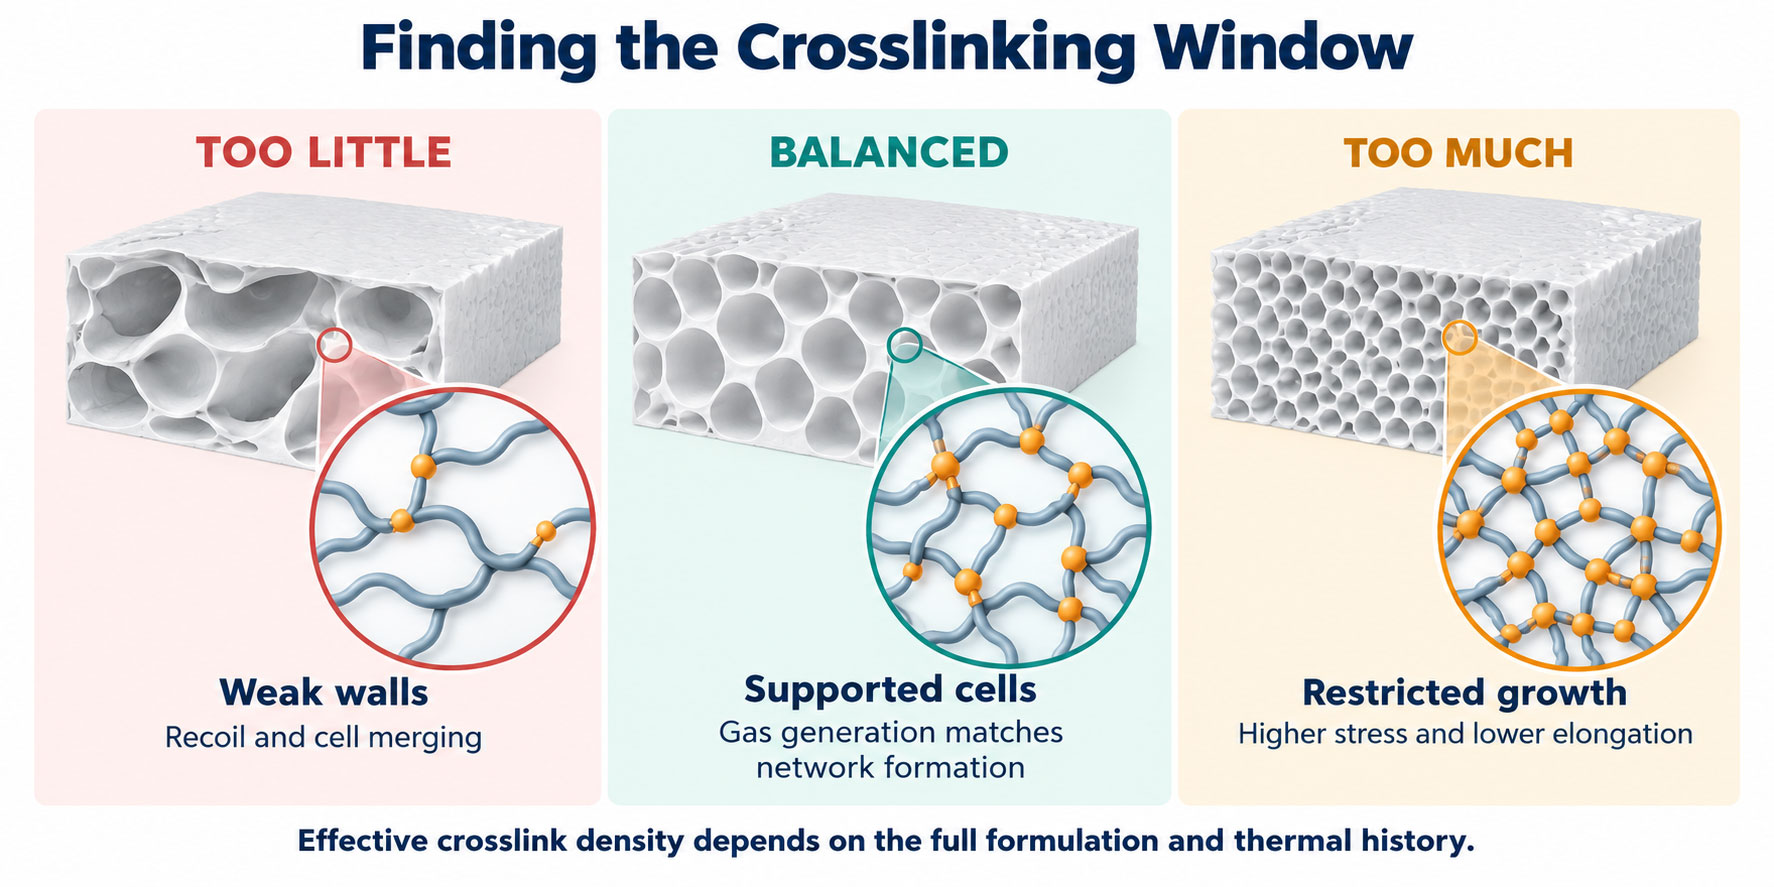
When crosslinking is insufficient
Cell walls have inadequate load-bearing strength, increasing the risk of cell merging, rupture and demolding shrink-back.
More chains remain free to recover during conditioning and secondary heating.
If low-melting POE dilutes the EVA network and DCP is not recalibrated, the problem can become more pronounced.
When crosslinking is excessive
Cell growth is restricted, reducing expansion and increasing density and hardness.
Reduced chain extensibility may impair tear strength, elongation and dynamic fatigue resistance.
Demolding expansion and internal stress can increase; dimensions may become less stable and warpage may occur.
G ≈ νeRT
In the rubbery plateau, this relationship links shear modulus G to effective network-chain density νₑ. Crystals and fillers also contribute to modulus in semicrystalline EVA and POE foams. Cross-check MDR or rheology curves, gel fraction, equilibrium swelling and final cell morphology; DCP phr alone does not define crosslink density.
5 Synchronizing crosslinking and gas generation
The aim is neither complete crosslinking before foaming nor extensive gas generation before a network exists. Establish the minimum necessary melt strength before rapid gas release, then strengthen the network as cells grow. DCP, ADC or other blowing agents, activators and actual compound temperature determine the timing.
| Mismatch | Cell outcome | Shrinkage pattern | Check first |
|---|---|---|---|
| Gas generation before network formation | Oversized, merged or ruptured cells | Rapid shrink-back after demolding | Compound temperature, activators, DCP half-life and mixing thermal history |
| Network forms too early | Restricted growth and low expansion | High density and internal stress | DCP dosage, mold temperature and molding time |
| Uneven network formation | Different cells in the skin and core | Local sink marks and warpage | Dispersion, batch mixing, thickness and heating uniformity |
| Insufficient post-cure | Normal initial appearance followed by drift | Post-shrinkage after 24–72 hours | Core temperature, holding time and gel fraction |
Three controls to establish before development trials
1. Hold finished foam density constant, rather than only fixing formulation weight. Density differences directly affect hardness and shrinkage.
2. Record actual compound and mold-core temperatures, rather than equipment settings alone.
3. Measure dimensions at 0, 24 and 72 hours and after secondary heating under the same storage and conditioning conditions.
6 Cooling the core before dimensional release
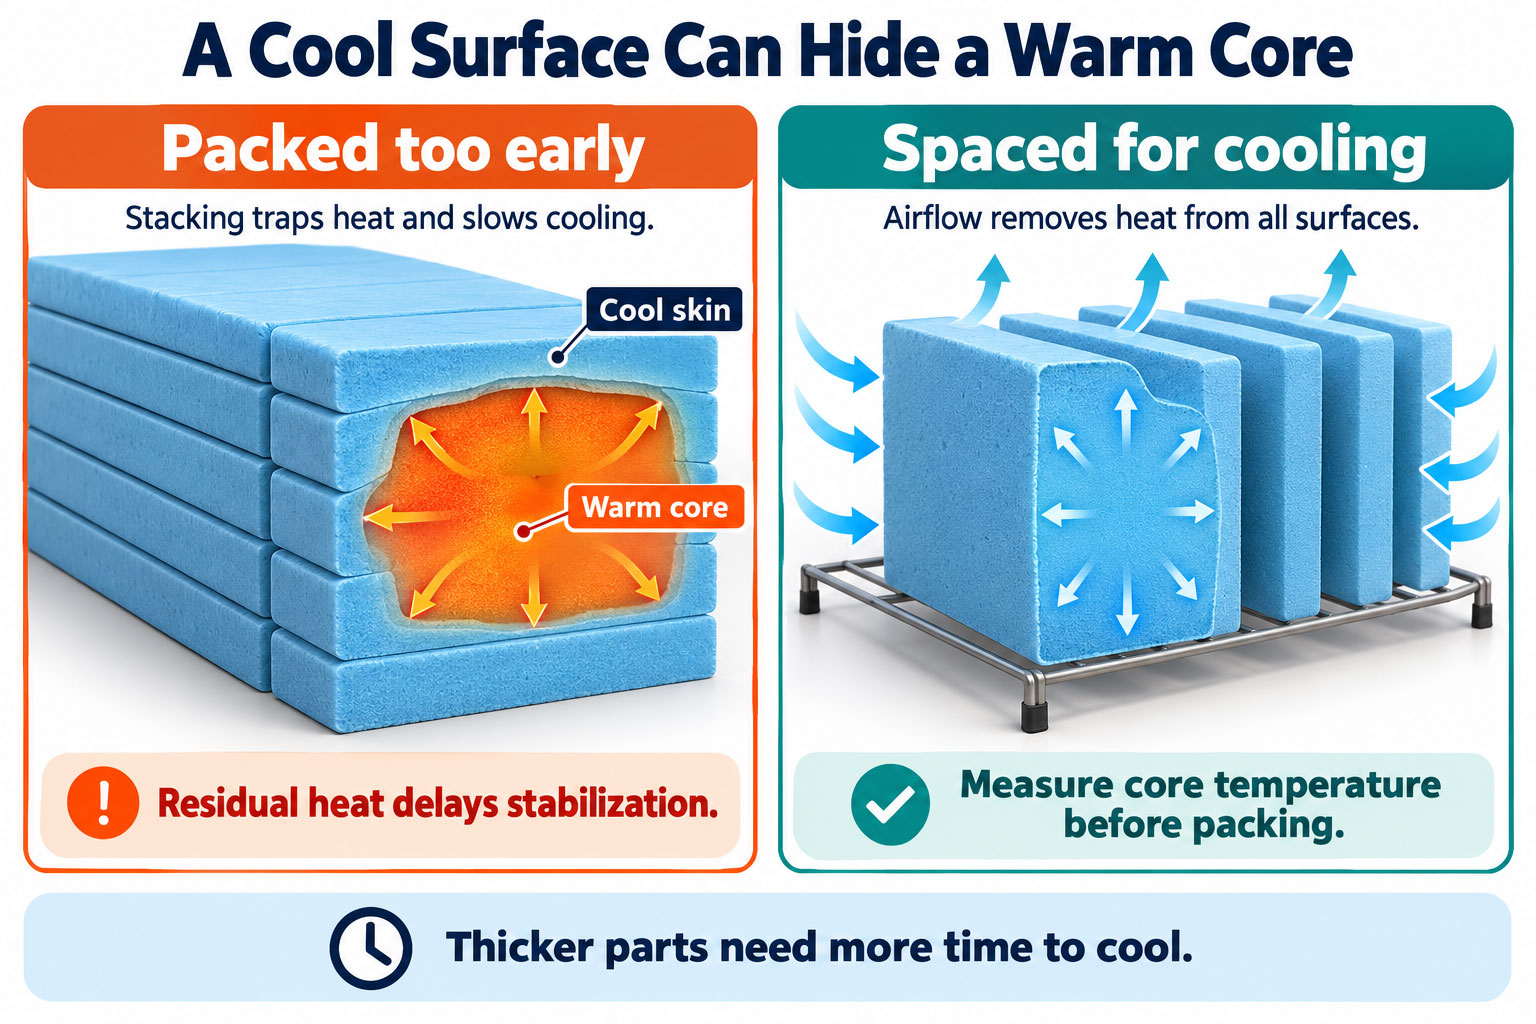
Foam has low thermal conductivity, so the center of a thick part cools slowly. For similar geometries, an engineering approximation relates cooling time t to characteristic thickness L and thermal diffusivity α.
t ∝ L2α
Doubling characteristic thickness may require roughly four times as long to reach a comparable core temperature. Stacking, bagging or starting lamination too early can trap heat. Crystals may then reorganize while the part is constrained, producing dimensional differences between batches.
A cool surface alone is therefore insufficient evidence that a part is ready. Check the core temperature and use consistent cooling, spacing and conditioning practices.
7 How IUS-4065 may help ultra-soft formulations
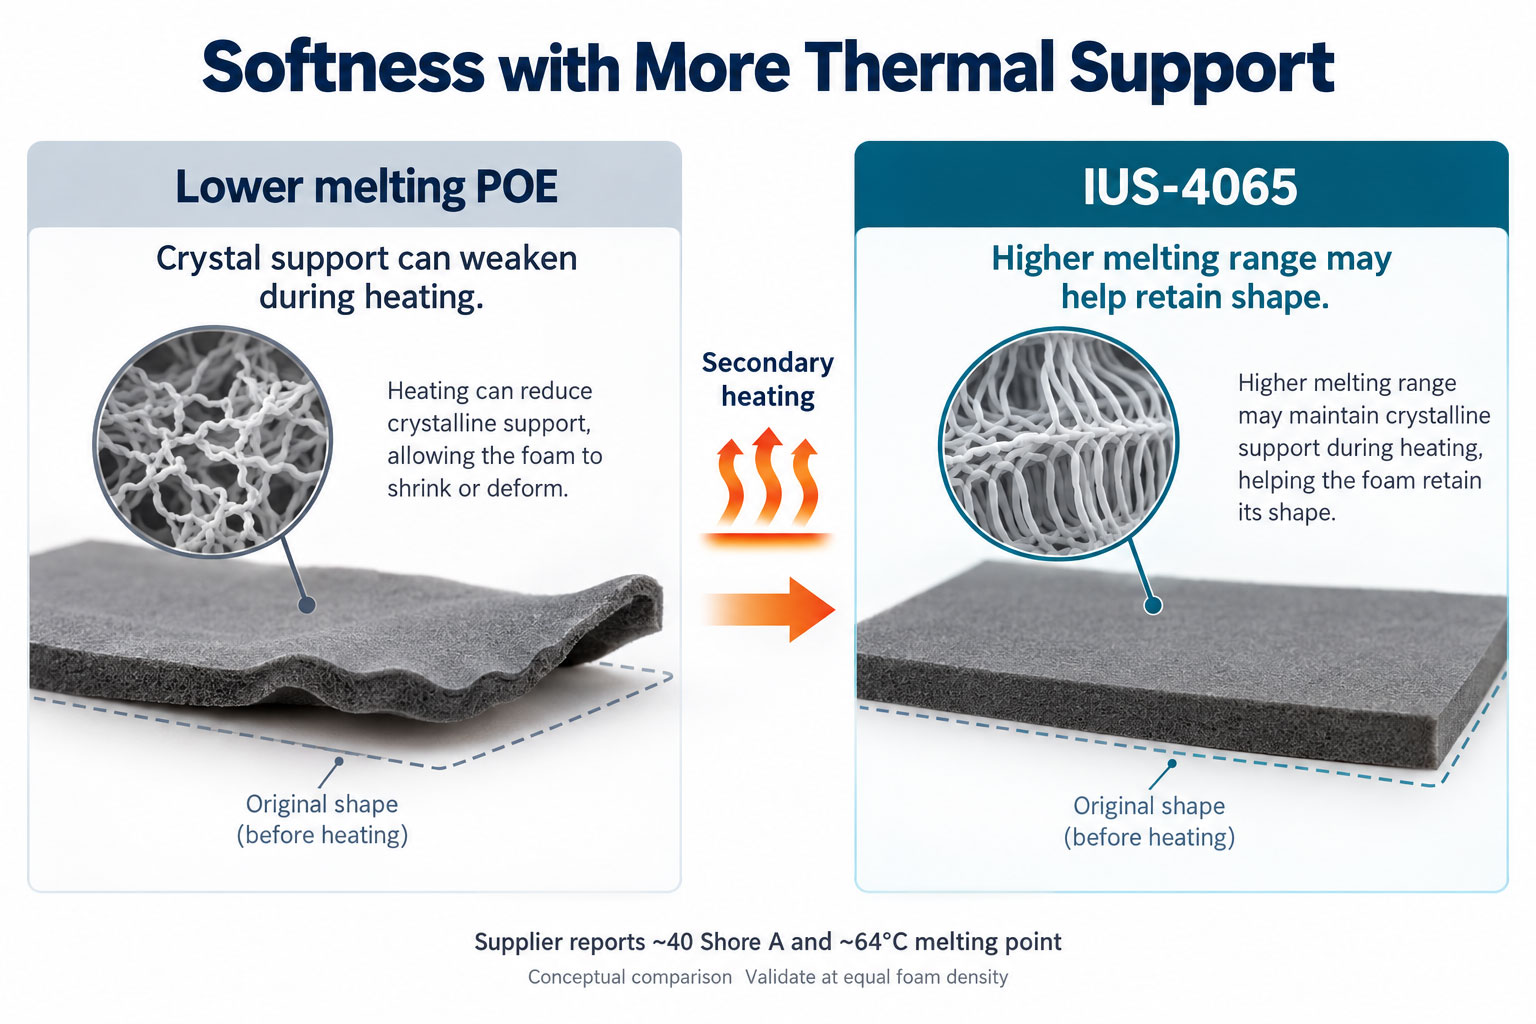
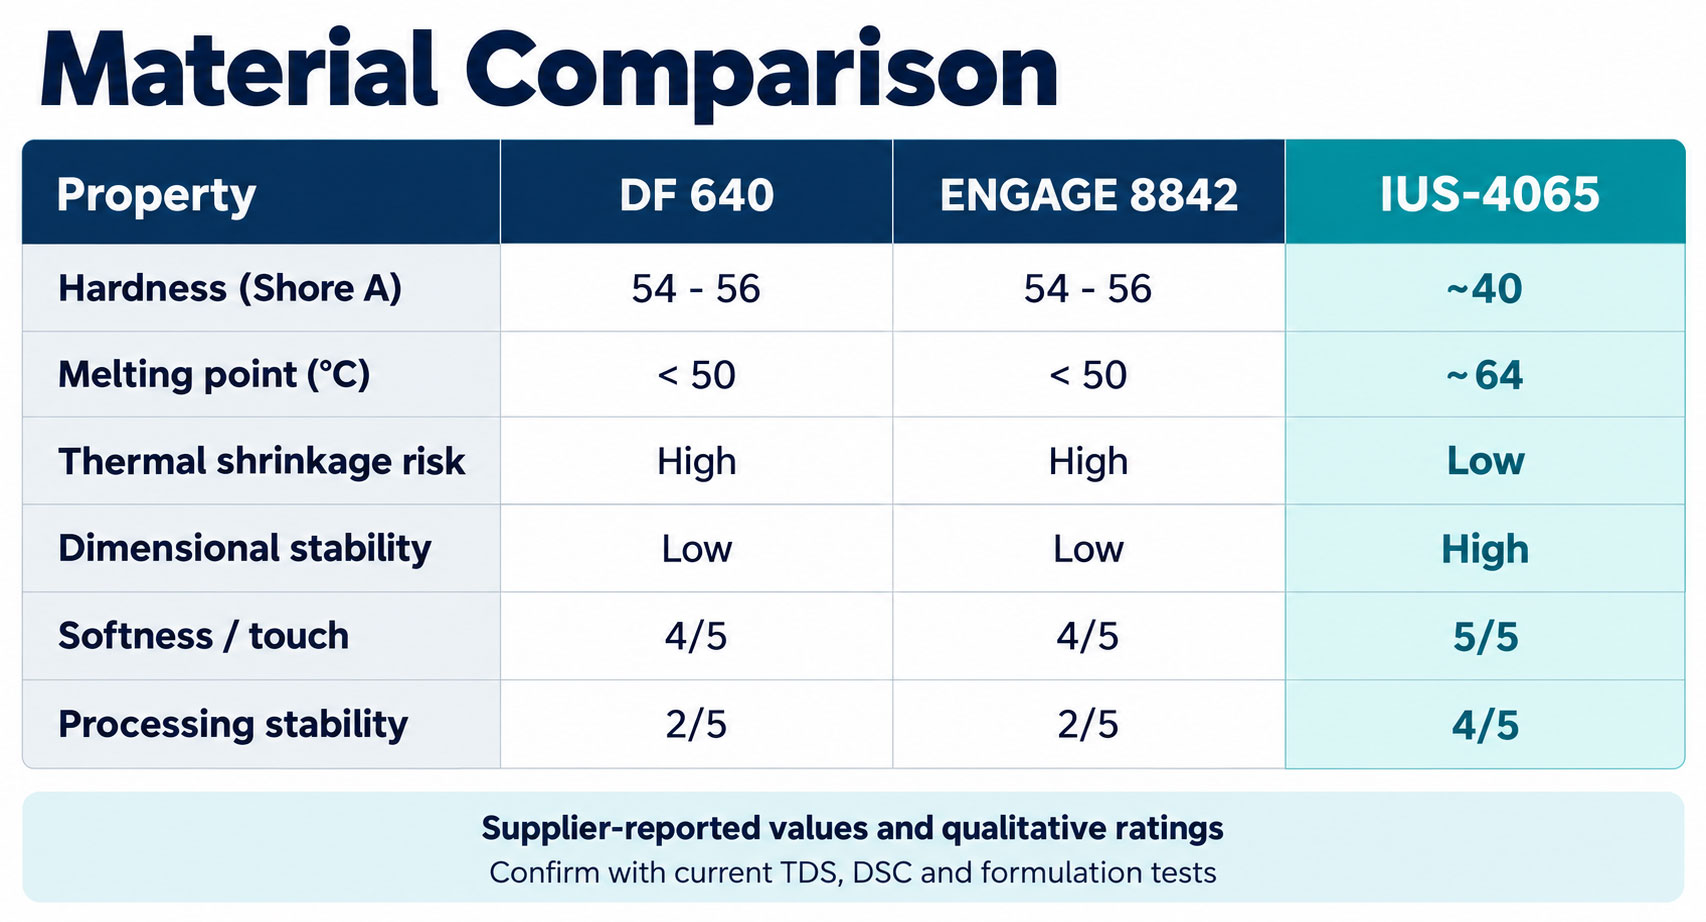
The INNOARK comparison supplied for this analysis reports raw-material hardness of about 40 Shore A and a melting point of about 64°C for IUS-4065. DF 640 and ENGAGE 8842 are shown at about 54–56 Shore A with melting points below 50°C. The proposed value of IUS-4065 is therefore more than lowering hardness: it shifts the principal melting-support range upward while remaining softer.
Many ultra-soft formulations use TAFMER or ENGAGE series POE to lower hardness. The supplier associates low-melting formulations with secondary shrinkage and deformation, and proposes IUS-4065 as an alternative balance of softness and thermal support. Final behavior depends on the formulation, density and process.
7 Material selection and formulation limits
| Comparison | Conventional ultra-soft low-melting POE | Proposed IUS-4065 benefit |
|---|---|---|
| Softness | May require higher POE or oil content to reach lower hardness | About 40 Shore A may allow the target to be reached at a more effective loading |
| Secondary thermal support | Crystalline support may fall rapidly near 50°C | About 64°C melting point may increase separation between lamination conditions and melting |
| Dimensional stability | Shrinkage and warpage are sensitive to thermal history | Supplier claims lower thermal shrinkage and greater dimensional stability |
| Production window | DCP, expansion and cooling tolerance may be narrow | May improve yield and appearance consistency; formulation validation is required |
Application limits. A melting point of about 64°C is not the finished product’s heat-resistance limit and does not establish a direct one-for-one replacement. Changes in EVA VA content, IUS-4065 loading, DCP efficiency, expansion and cooling require a new process window.
8 Reformulating when introducing IUS-4065
1. Establish the original formulation baseline. Record the current POE, EVA VA content, DCP, blowing agent, activator, density, hardness and 72-hour shrinkage.
2. Test three IUS-4065 loading strategies. Include equal loading, replacement at equivalent target hardness and a reduced total soft-phase content; do not rely on equal substitution alone.
3. Test three DCP levels. Use low, medium and high effective dosage with MDR or rheology curves to locate the crosslinking and gas-generation balance.
4. Compare properties at the same foam density. Evaluate rebound, compression set, tear strength, elongation and cells so expansion differences do not create a misleading advantage.
5. Include the secondary thermal history. Run temperature-by-time tests matching the customer’s lamination conditions, rather than measuring only immediately after demolding.
9 Quantifying shrinkage through DOE
Use a design of experiments (DOE) to distinguish material, reaction and cooling effects. Adjusting by feel alone can conceal tradeoffs between softness, expansion and stability.
| Factor | Suggested levels | Main responses |
|---|---|---|
| POE and IUS-4065 ratio | Low, medium and high; or equivalent-hardness replacement | Hardness, rebound, DSC and dimensions |
| Effective DCP dosage | Low, medium and high | t10, t90, gel fraction, expansion and tear strength |
| Molding conditions | Temperature × time | Core temperature, cells and demolding shrink-back |
| Cooling method | Fixture, air or water cooling; different conditioning times | Length, width and thickness at 0, 24 and 72 hours |
| Secondary heating | 50, 60 and 70°C × 30 and 60 minutes | Thermal shrinkage, warpage and hardness drift |
Linear shrinkage calculation
SL (%) = L0 - LtL0 × 100%
L₀ is the initial reference dimension and Lₜ is the dimension at the defined time or after treatment. Measure length, width and thickness separately. For volume stability, calculate V₀ and Vₜ separately. Define conditioning temperature, humidity, time and measurement locations before testing.
Minimum production specifications
Length, width and thickness at 30 minutes, 24 hours and 72 hours after mold opening.
Dimensional shrinkage and flatness after lamination or heat treatment.
Density and cell differences between cavities and between the center and edges.
Finished density, hardness, rebound, compression set, tear strength and elongation.
Means, standard deviations and process capability across three consecutive batches, rather than a single best sample.
10 A quick production diagnosis
| Symptom | Likely causes | First action |
|---|---|---|
| Immediate shrinkage after demolding | Insufficient crosslinking or premature gas generation | Check MDR and compound temperature; test three DCP levels and foaming timing |
| Shrinkage the next day | Gas diffusion, later crystallization or a warm core | Standardize 72-hour conditioning; measure core temperature and review stacking |
| Shrinkage after lamination | Low POE melting range or excessive thermal history | Run DSC and measure the actual lamination temperature profile; add an IUS-4065 control |
| Localized warpage | Uneven mold temperature, thickness or cooling | Check cavity heat distribution, fixtures and cooling contact |
| Low hardness together with low expansion | Excessive crosslinking or unsuitable melt rheology | Hold density constant, then retune DCP and the blowing agent |
Conclusion Synchronizing four reaction and transport clocks
Stable EVA and POE foam requires control of four interacting clocks: DCP network formation, blowing-agent gas generation, crystalline stabilization and cell gas exchange. Low-melting POE can quickly reduce hardness and improve feel, but earlier loss of crystalline support during secondary heating can expose insufficient crosslinking, gas diffusion and cooling gradients as dimensional shrinkage.
IUS-4065 offers a different supplier-reported balance at about 40 Shore A and a melting point of about 64°C. It may reduce secondary thermal shrinkage, widen the processing window and improve batch consistency without relying entirely on a low melting point for softness. Successful introduction means retaining dimensions after 72 hours and simulated lamination at the same density and required performance, rather than judging softness immediately after demolding.
Development decision. Evaluate which complete formulation can retain the foam cells under the selected DCP system, expansion ratio and customer lamination conditions; the softest POE alone is not enough to make that decision.
Appendix Recommended SEO settings
| Item | Recommended content |
|---|---|
| SEO title | Why Does EVA Foam Shrink? POE Melting Point, DCP Crosslink Density and Cooling Explained |
| Meta description | Explore EVA and POE foam shrinkage after demolding, storage and reheating, and how crosslinking, gas diffusion, cooling and IUS-4065 affect stability. |
| Suggested URL | /blog/eva-foam-shrinkage-poe-melting-crosslink-cooling-ius4065 |
| Core keywords | EVA foam shrinkage, POE melting point, DCP crosslink density, secondary thermal shrinkage, foam cooling, IUS-4065, EVA POE foam |
Data and technical statement
Hardness, melting points and qualitative comparisons for IUS-4065, DF 640 and ENGAGE 8842 are taken from the supplied INNOARK image data. Verify them against current supplier technical data sheets (TDS), safety data sheets (SDS), DSC and rheology reports, and production testing.
The mechanism analysis supports formulation and process diagnosis and does not replace those measurements or supplier documentation. DCP and blowing systems involve high-temperature reactions and decomposition risks. Formulation and process changes should follow material safety data, equipment requirements and factory environmental, health and safety (EHS) procedures.